I compared my sleep data with another Zeo user, Eva, who seems to have a normal sleep architecture.
The Fig. 1 simply shows our respective sleep architectures compared to the rest of the Zeo users (we have the same age, the comparison is quite fair then). If we both spend roughly the same total sleep time, not surprisingly, Eva spends on average much more time in REM sleep than I do.
The Fig. 2 is interesting since it presents our two charts representing the different Zeo sleep stages with the data starting at the onset of sleep. On both charts, we can clearly see our respective deep sleep cycles starting roughly at the same moment after sleep onset. However, there is a clear difference between our two charts regarding REM cycles. Eva's ones are those commonly observed in adults with normal sleep patterns, whereas the distribution of REM sleep throughout the night seems completely chaotic in my case.
Finally, the Figs. 3 & 4 present a comparison of our bedtimes and waking times on the long run. It notably shows that in our both cases, we do not really respect stable schedules. However, it does not impair Eva's sleep quality at all, which might go against the sometimes too easy statement from sleep experts on the fact that it is very important to respect constant schedules (at +/- 30 mins) for keeping your body clocks in sync (which is important of course, but not the definitive answer to my issues I believe!).
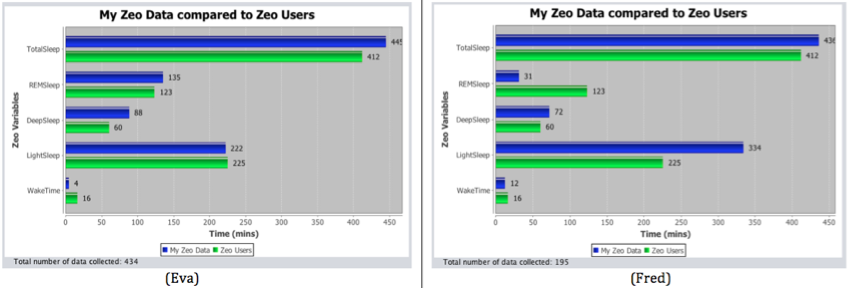
Fig. 1: Sleep Architecture Comparison.
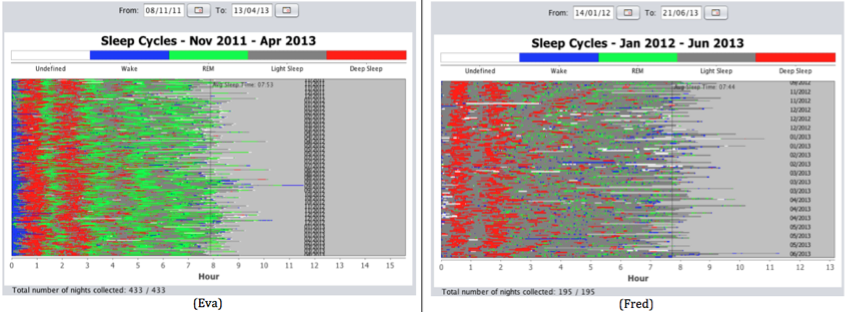
Fig. 2: Sleep Stage Cycles Comparison.
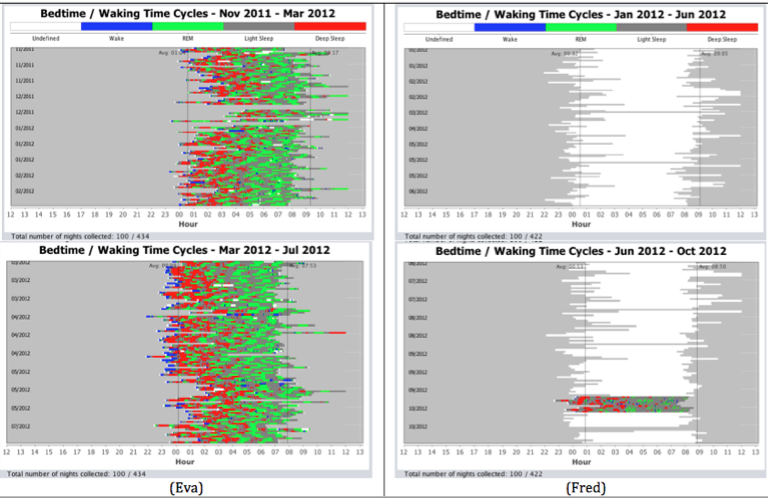
Fig. 3: Bedtimes - Waking times Comparison (1/2).
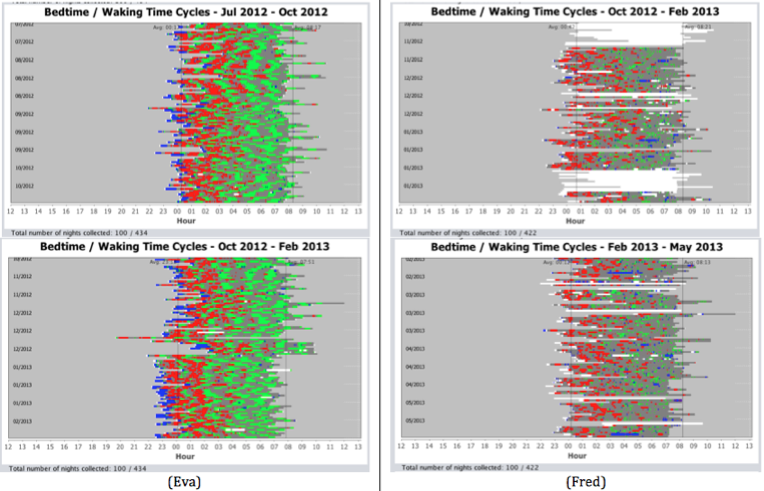
Fig. 4: Bedtimes - Waking times Comparison (2/2).