I collect data on a daily basis from the following sources:
- the Zeo Sleep Manager (mobile version with the iPhone application),
- the iPhone application Sleep Cycle (simply based on the recording of your movement while you sleep using the smart phone's accelerometer),
- the withings devices (scales and blood pressure monitor),
- the Runkeeper iPhone application for tracking my workouts (coupled with two other iPhone applications synced with my Runkeeper account),
- the Lumen Trails iPhone application for tracking data every mornings and evenings (around 40 variables in total, e.g., subjective quality of my sleep, mood, stress levels, etc., and supplements intake, coffee, among others).
And I also collect data (but only occasionally) from the following ones:
- the SweetBeat iPhone application, used with a Wahoo heart rate monitor, for tracking my heart rate at night (in order to perform Heart Rate Variability analysis - HRV - on this collected data),
- the SnoreMonitor iPhone application, mainly for night audio recording (can be useful for detecting potential sleep apneas).
Since it is really cumbersome to rigorously collect data on a daily basis, the gathering process must be as less intrusive as possible, specially for these 40 variables I track every mornings and evenings. Relying on a smart phone for that is very handy. In my case, I set up iPhone alerts in order not to forget filling out my list of variables defined in Lumen Trails, and I can record them from my phone wherever I am.
The figure below presents the process I put on place for gathering, centralizing and analyzing the data I track. The 3 main phases of the process are the following:
- Data from the different sources are exported manually on my machine as a set of Excel files.
- I implemented a simple Java program for collecting automatically these inputs and carry them forward in a centralized Excel file.
- Finally, all the data is collected by the Java program and can be visualized via basic graphical interfaces from which different charts can be displayed according to input parameters chosen from the interface (which is quite handy is order to find out relevant results sometimes "hidden" in the data set).
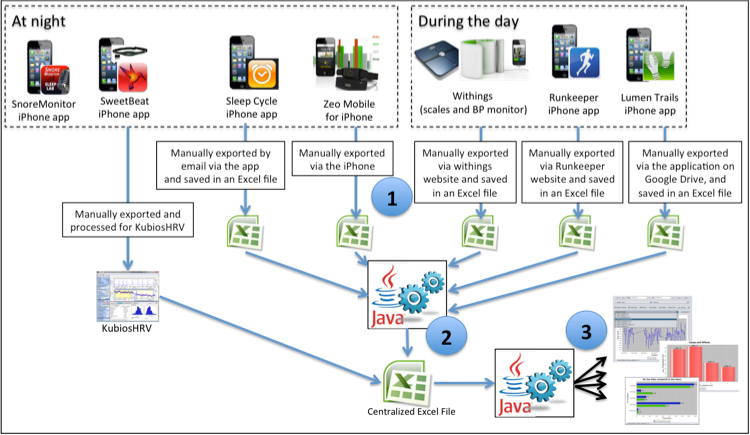
Fig. 1: Data Gathering Process - From Tracking to Analysis/Visualization Phases.
So far the Java program I prototyped provides the capability to display 5 different charts (screenshots are given below):
- The Cause vs. Effects chart (inspired by what was provided by the Zeo website, see Fig. 2),
- The chart for comparing the sleep architecture between 2 time frames (see Fig. 3),
- A more advanced chart for displaying trends (with average, throughout a given timeframe, or by mean values by week/month) according to different variables (see Fig. 4).
- A chart representing the different Zeo sleep stages with the data starting at the onset of sleep (inspired by a graph implemented in the ZeoLibrary), useful for pointing out redundant patterns in sleep cycles (see Fig. 5),
- A chart focused on bedtime and waking time trends (see Fig. 6).
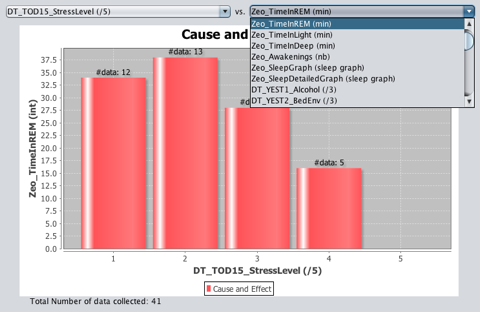
Fig. 2: Cause and Effects chart.
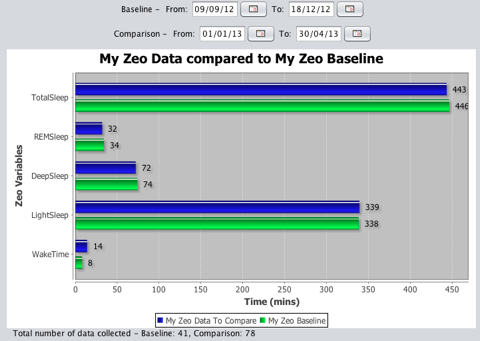
Fig. 3: Sleep architecture comparison.
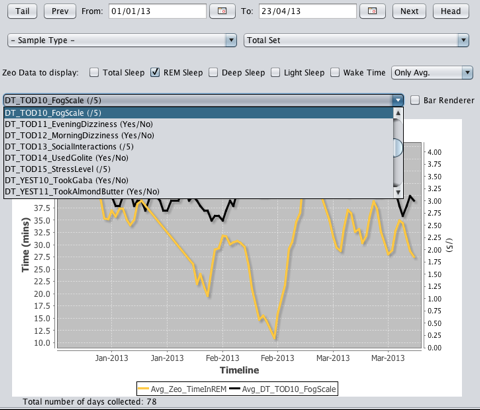
Fig. 4: Chart for displaying trends over time of the data tracked.
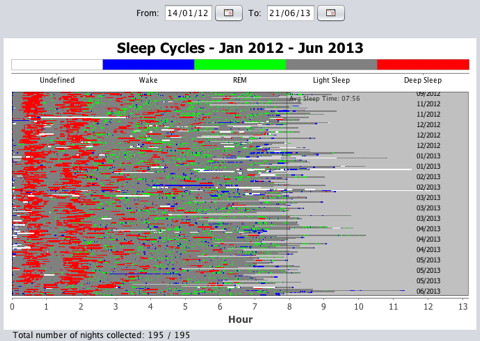
Fig. 5: Sleep Cycles.
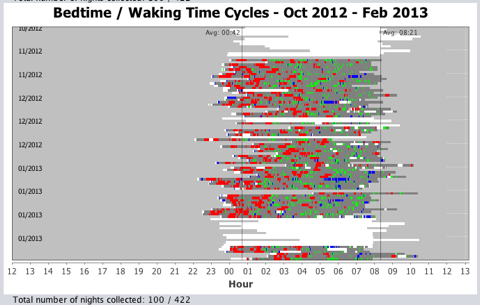
Fig. 6: Bedtime / Waking Time Trends.